Events
  Places
  Fish
Fish  Research
  Sign in
  New Catch Log
  New Trip Log
  By Sean Simmons • Aug 7, 2022
 One of the comparisons conducted as part of the initial scientific paper published in the Canadian Journal of Fisheries and Aquatic Sciences , we looked at how MyCatch data compared with Fall Index Netting surveys conducted by the Alberta Environment and Parks. Results from this analysis were mixed as some clear differences in the data emerged.
SPECIES COMPOSITION COMPARISONS
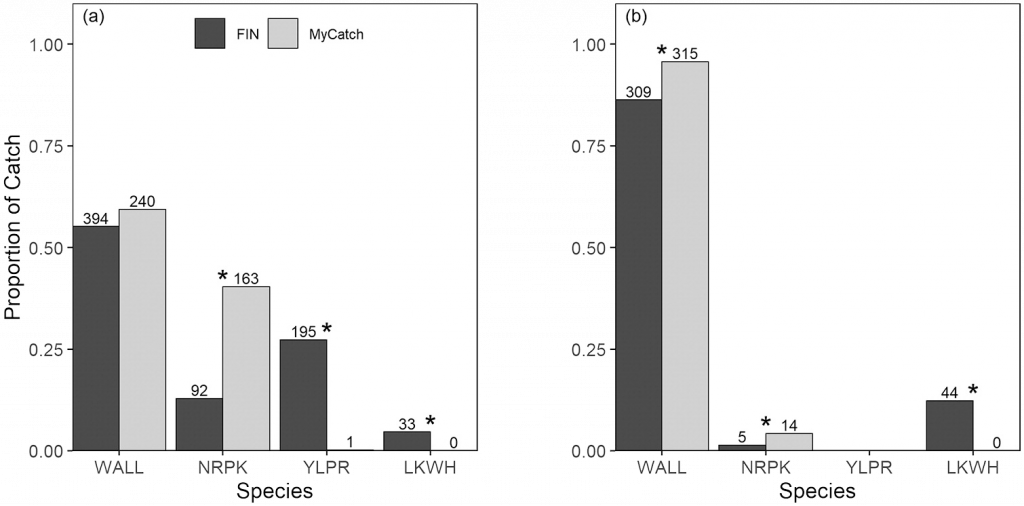
The first comparison looked at the catch composition from anglers and from netting. Figure 9 shows composition found in two popular Alberta lakes (Lac La Biche and Pigeon Lake). Walleye proportions are similar, however northern pike has significant differences with MyCatch anglers reported much higher proportions of this fish than the nets caught. Furthermore, lake whitefish and yellow perch were not reported by anglers but were caught in the nets. These differences are likely due to the angler preferences of targeting particular species.
CATCH RATE COMPARISONS
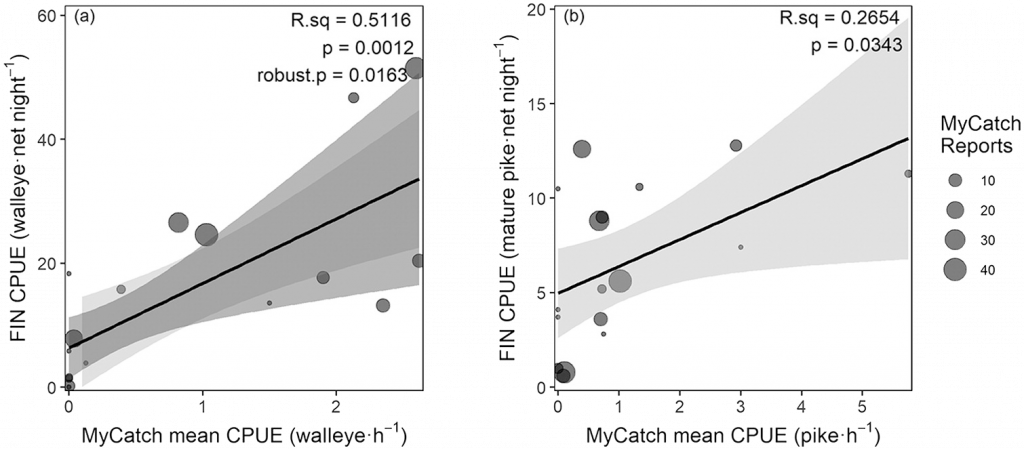
When looking at relative catch rates between netting surveys and MyCatch, a correlation was observed with walleye, however Northern Pike again showed no clear connection. Figure 8 illustrates this difference and suggests that there is something odd happening with northern pike – why do the other patterns match well (see Creel Comparison and DFO Benchmarking). One possible explanation is that northern pike inhabit the shallows which are easily targeted by anglers but difficult for netting surveys to reach. This difference suggests further work is needed to better understand why northern pike is disproportionately represented by anglers whereas walleye is not.
Netting surveys are a very common form of fisheries survey and as MyCatch has evolved from this initial design, further work has been undertaken to do more robust analyses around netting surveys. In particular, MyCatch launched app based catch-photo-release tournaments in 2020 which are providing might resolution data around fish lengths and are providing exciting new ways to collect fisheries data. So stay tuned for more research with netting (as well as electrofishing).
Header image provided by Angler’s Atlas member rpstasiuk.

 Research Project