 Events
  Places
  Fish
Fish  Research
  Sign in
  New Catch Log
  New Trip Log
  By Sean Simmons • Aug 7, 2022
 When MyCatch first launched in 2018, the first goal was to see if the app (and website) could collect reliable creel data from anglers. To keep it as simple as possible, we focused on collecting data on just four core variables:
- Where did they fish?
- When did they fish?
- How long did they fish?
- What did they catch (including zeroes)?
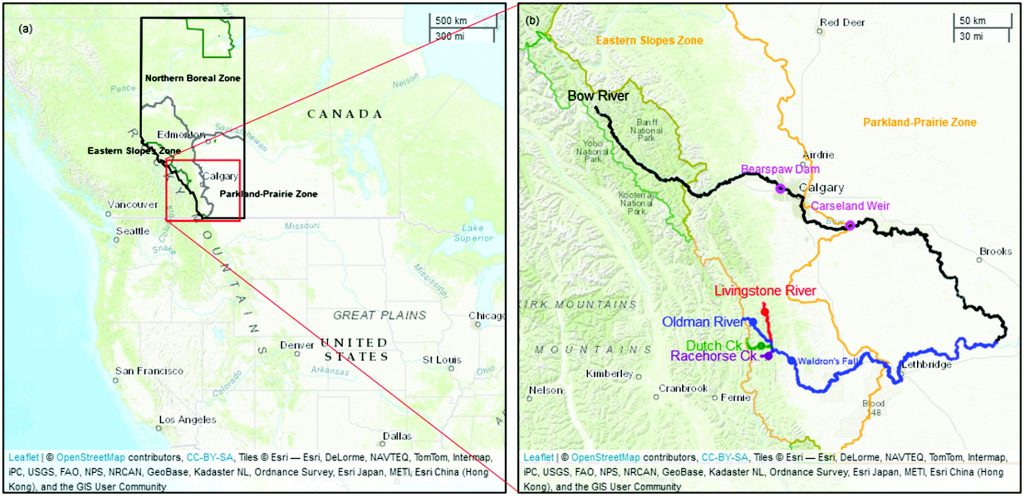
After we launched the project and began collecting the data, the next challenge was assessing the quality of the data. Were we getting data that was consistent with conventional creel surveys? Fortunately we had two conventional surveys taking place at the same time (spring/summer of 2018) on the Bow River and Oldman/Livingston Rivers in southern Alberta. This provided two good surveys that we could benchmark MyCatch data against.
SPECIES COMPOSITION
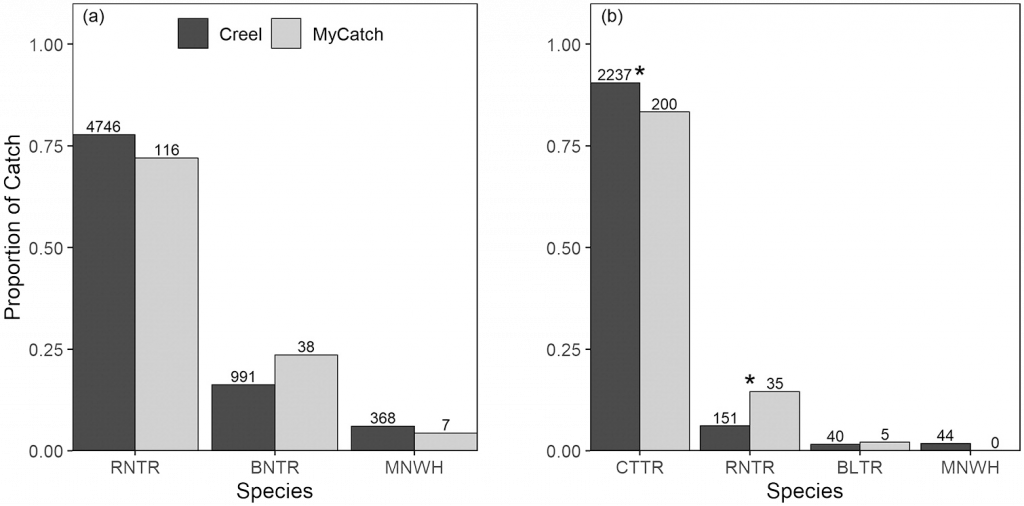
As a starting point for the analysis, we compared species composition as a proportion of catch between the two methods. In both systems MyCatch data tracked closely with the data obtained through the creel surveys. Some differences were noted between cutthroat trout and rainbow trout on the Oldman / Livingston rivers, however we expect that had to do with hybridization between these two species. At the time of the study the option to select hybrids through the app was not available so anglers had to select one or the other.
CATCH RATE
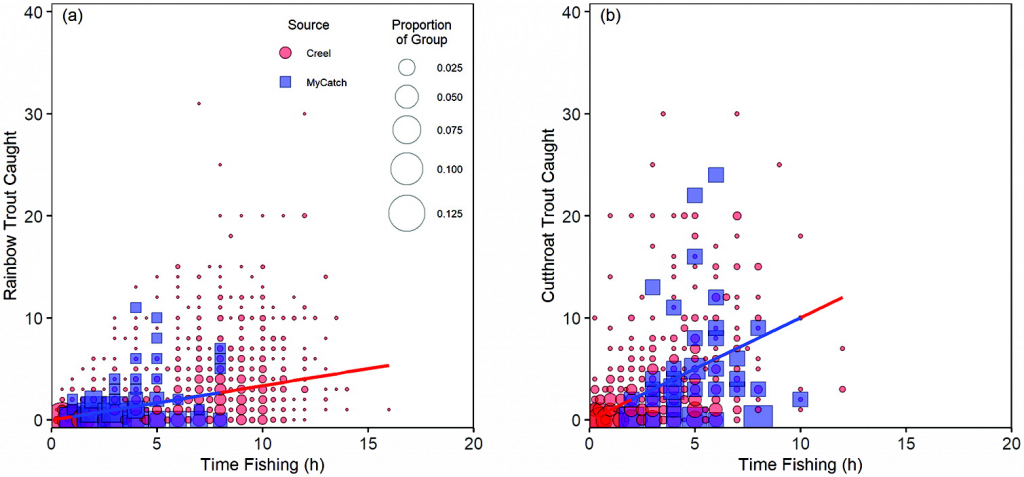
As part of the evaluation, a series of models were evaluated to find the most parsimonious model where catch rate data was compared between MyCatch and the two creel surveys. Through this model development, we were able to generate nearly identical catch rate predictions using MyCatch data for both systems. The red and blue lines in Figure 7 reflect the predicted catch rates for the creel surveys (red) and MyCatch (blue).
DISCUSSION
Overall, the creel comparisons for both the Bow River and the Oldman/Livingston Rivers show the MyCatch data can yield similar species compositions from anglers, as well as similar catch rates. Much work is still needed on this front, however as a first step it shows the potential for using app data to supplement ongoing creel surveys.
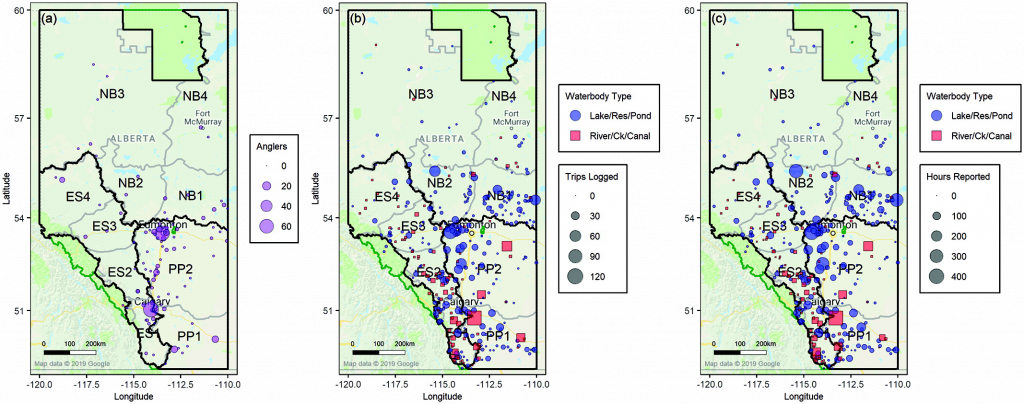
The real advantage to MyCatch comes from the scale of data that can be collected compared to creel surveys. Where a creel survey is very expensive and covers a very limited geographic area, MyCatch is not constrained in this way, and the volume of data is exponentially greater covering hundreds of waterbodies across the landscape. Figure 2 below shows the data collected across the province of Alberta in 2018, when the two creel surveys were conducted.
These results were published in the Canadian Journal of Fisheries and Aquatic Sciences in 2021. You can access to the full paper here.

 Research Project